Flyers are one of the best media solutions to grab attention. Doesn’t matter if you are launching a new product, running a local advertisement campaign, or advertising a community event; you can use a flyer according to your needs. But the issue is that most marketers don’t know which flyer design is best, and for that, they can take the help of A/B testing.
Digital marketers already perform A/B testing on landing pages and email subject lines to get better results, and they can do the same with flyers too. They can test 2 or more flyers to know which version is getting more attention.
In this article, we will understand A/B testing, how you can use it for flyers, and how to track and optimize your results according to your needs.
What Is A/B Testing for Flyers?
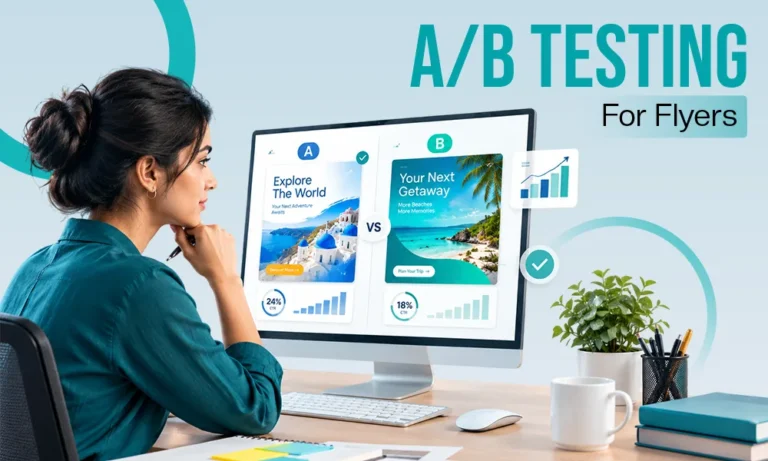
A/B testing, or split testing, is when you make two different designs of your flyer – for example, let’s call them Version A and Version B – and share these versions with two similar groups. Then, you check which one performs better based on some predetermined goals, like getting more website views, foot traffic at a store, phone calls, or QR code scans.
Why Flyer A/B Testing Works
You might think that a bright, colorful flyer is always better than a simple one, but your customers might see it differently. With A/B testing, you can move from guessing to making choices based on actual responses.
Fascinatingly, in today’s competitive marketing world, data show that nearly 65% of businesses report that systematic usage of A/B testing tools resulted in conversion rate improvements of 10% or more.
So, what can you test on a flyer?
You don’t have to change everything. Some of the easiest elements to A/B test include:
- Headline – Try different wording to see which one grabs more attention.
- Call-to-Action (CTA) – For example, “Call now” vs. “Visit our website.”
- Images or graphics – See if a photo of your product beats a lifestyle shot.
- Color scheme – Brighter doesn’t always mean better.
- QR code placement – Test left vs. right placement or size.
How to Set Up a Flyer A/B Test
Here’s a simple 4-step plan:
1. Establish Your Objective
What do you want people to do after seeing the flyer? Think of specifics. Perhaps it’s to reach your landing page by scanning a QR code. That becomes your primary metric.
2. Two Versions of the Design
Make two versions: A and B. Remove only one element between the two designs, such as the picture or the call to action. In this manner, you’ll be able to see more specifically why performance differed.
3. Choose Your Test Groups
Give each version to a different but comparable audience. Give 100 flyers of each version, for example, in two nearby zip codes with comparable populations.
4. Track the Results
Use unique QR codes or URLs to track responses on flyers. Tools like Google Analytics, Bitly, or UTM codes can show you which flyer drove more engagement.
Tracking Tips to Keep Your Data Accurate
Your test is only useful if the data behind it is reliable. A few simple steps can make your results much easier to interpret:
- Use different UTM parameters for each version of the flyer so you can differentiate traffic from Version A and Version B.
- Give each flyer a unique QR code or short URL that leads to the same landing page but uses two different tracking parameters.
- Track offline responses, too. If your goal is store visits, event attendance, or phone calls, use unique discount codes, phone extensions, or simply ask customers how they heard about you.
Keep the distribution conditions as similar as possible. Differences in location, timing, weather, or audience size can affect your results just as much as the flyer design itself.
It’s also worth being careful about the tools and files you use during the process.
Flyer campaigns can include downloading images, opening shared design files, testing QR code generators, and using third-party marketing applications, so stick to reputable sources and keep your device protected with up-to-date security software.
If you want to explore antivirus options before committing to one, this information source covers a free trial option.
Optimizing Based on Your Results
Once you’ve received your data, the real magic begins: optimization!
How the Winning Version Should Be Used
You now have a template to use in subsequent flyers if Version B performed better. Don’t just stop there, though. The process of A/B testing is ongoing. To further hone your findings, test the following variable.
What Happens If There’s No Clear Winner?
It’s OK! Occasionally, the outcomes are too close to call. It might indicate that your audience is divided or that the variable you examined wasn’t sufficiently essential. If so, attempt a more obvious modification the following time.
Final Thoughts
Flyer marketing doesn’t have to be a shot in the dark. A/B testing helps to give you a simple way to make design decisions based on real audience behaviour rather than guesswork.
Begin by testing one element at a time, analyze the results, and use what you learn to improve the next version. Over time, those small changes can help you create more effective flyers and make better decisions across your wider marketing strategy.
FAQs
Q1. What is A/B testing for a flyer?
Ans: It is a method to compare two slightly different flyers against each other to determine which one performs better based on audience response.
Q2. What elements should I test on flyers?
Ans: Test things such as discount amount, visual imagery, headlines, and call to action(CTA).
Q3. What are common A/B testing mistakes?
Ans: Common A/B mistakes include failing to reach an adequate sample size, stopping the test too early, or testing without clear data.
Q4. How many variables should I test at once?
Ans:Test only one variable at a time. If you change the headline and CTA, you won’t know which causes an increase in responses.